
User Guide
Creating graphs
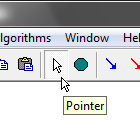
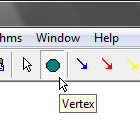
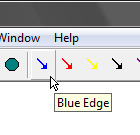
There are three basic tools in the application: the pointer tool, the vertex tool and the edge tool. When the vertex tool is selected, the user creates new vertices of the graph by clicking in the document window. Then, doing a "drag and drop" with the edge tool selected, edges can be added to the graph. Edges can have different colors, where each color represent a different graph (on a shared vertex set). Pointer tool is used to select,move and delete vertices and edges.
 |
 |
 |
Working with graphs
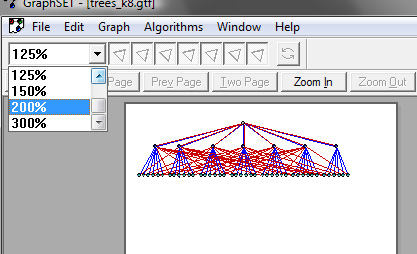
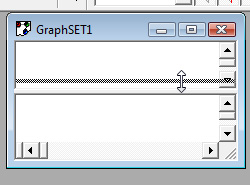
The purpose of the GraphSET is to help with simultaneous embedding problems. These problems arise when a drawing of several graphs with a shared vertex set is needed. To help with these, the tool provides the option to hide and show different graphs (edge colors). User can have multiple views and visualize different edges on each view. To get a different view of the same graph, select the option New Editor Window int the Window menu. Another option is to divide the view by moving the splitter in the window as shown in the in the figure.
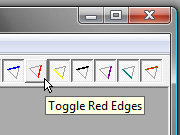
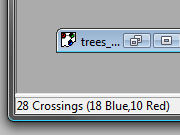
There are buttons in the toolbar to hide and show edges of each color. The number of crossings on each graph appears in the left section of the status bar.
 |
 |
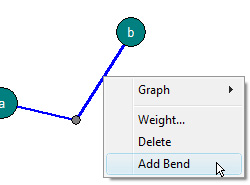
In the Edit menu, there are options to Flip or Rotate a selected subgraph. There is also an option to Swap Adjacency Lists between vertices. Both vertices and edges have a context menu that can be launched with a right click over the object. The contex menu for vertices allows for resizing, changing color, changing label, etc. The context menu for edges allows the addition of bends among other commands.
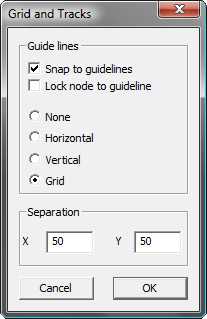
Grid and Tracks
The Grid and Tracks dialog box can be accesed from the Edit menu. The user can choose between horizontal, vertical or both guide lines (grid). When the Snap option is selected, vertices can move freely but their position is "adjusted" to the closest guide line (or grid point). The Lock option ensures that a vertex is drawn over a particular track. This feature is useful with problems related to level planarity, embeddings with monotonic paths, etc. There are two ways to assign track numbers to the vertices: 1) Using the context menu on each vertex and type the track number directly; or 2) Using the Set Track Numbers command in the Edit menu, this will assign consecutive track numbers according to the y-coordinate of the vertices.
Algorithms
The application features algorithms to recognize and draw ULP trees. These algorithms run when the user selects the Find and Draw ULP trees command in the Algorithms menu.
An implementation of the PQ-tree data-structure and the planarity testing algorithm by Booth and Leuker is included in the application. To see the PQ-tree reduction of a graph, use the Planarity Testing command in the Algorithms menu. Then open the window that display the PQ-trees using the command New PQ-Tree window in the Window menu.
The level planarity testing and embedding algorithms by Healy, Kuusik and Harrigan using the Vertex-Exchange Graph are also implemented. These can also be found in the Algorithms menu.
Random Graphs
GraphSET includes the following random tree generators:
- Labeled Trees. An implementation of the Prüfer code algorithm. Go to the Random Generators menu, and then select Generate Random Labeled Tree.
- Unlabeled Rooted Trees. An implementation of the RanRUT algorithm by Wilf. Go to the Random Generators menu, and then select Generate Random Rooted Unlabeled Tree.
- Unlabeled Trees. An implementation of the algorithm by Wilf to generate free trees and two rejection sampling procedures (one from labeled trees and another one from rooted trees). Go to the Random Generators menu, and then select one of the Generate Random Free Tree commands.
